
Microsoft AI Diffusion Report Reveals 70% Adoption in UAE, 31% in US, and a Deepening Digital Divide
The Microsoft AI Diffusion Report for Q1 2026 shows 17.8% of global working-age adults use AI, with UAE at 70% and Singapore at 63%, while the US trails at 31%. The data highlight a persistent digital divide and a heavy reliance on Microsoft’s telemetry, which may undercount China’s domestic AI ecosystem.
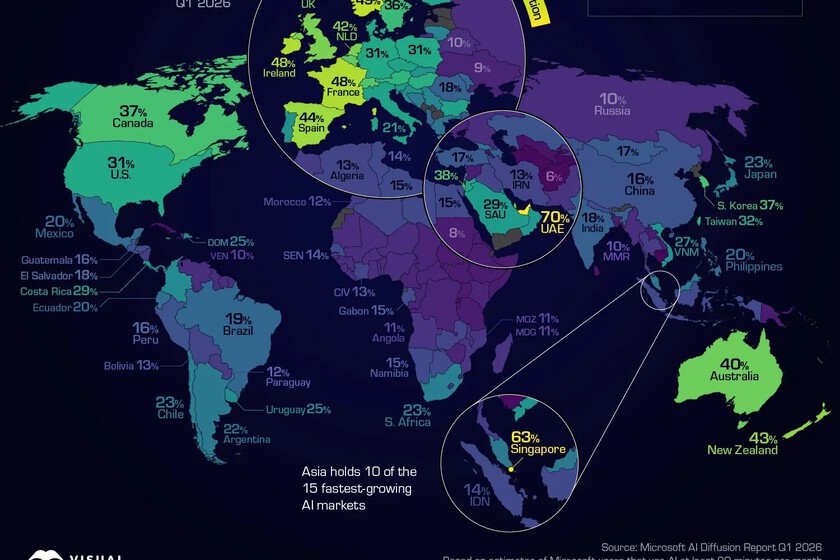
The Microsoft AI Diffusion Report for the first quarter of 2026 provides a data-driven snapshot of generative AI tool usage across 100 countries. The headline figure is that 17.8% of the global working-age population now uses AI, but the distribution is heavily uneven. The top ten countries report adoption rates between 42% and 70%, while many nations in Africa, Central Asia, and Latin America remain in single digits.
The Global Picture
The report, visualized by Visual Capitalist, draws on anonymized telemetry from Microsoft products including Copilot, Azure AI, and Microsoft 365. Microsoft applies statistical adjustments to compensate for users who rely solely on non-Microsoft tools such as ChatGPT, Gemini, or Claude, but the company acknowledges this bias is not eliminated entirely. As a result, adoption in markets where domestic AI ecosystems dominate — notably China, with platforms like Baidu, Alibaba, DeepSeek, and Moonshot’s Kimi K3 — is likely undercounted.
Por que importa
Top Adopters and Laggards
The United Arab Emirates leads with 70% of its working-age population using AI, quadruple the global average growth rate. Singapore follows at 63%. The remaining top ten are mostly European: Norway (49%), Ireland and France (48% each), Spain (44%), New Zealand (43%), UK (42%), Netherlands (42%), and Qatar (42%). The pattern is consistent: moderately wealthy economies with strong digital infrastructure and proactive government policies.
The United States, despite being home to AI giants like OpenAI, Google, and Anthropic, shows only 31% adoption. This underscores that building AI models is distinct from achieving widespread everyday use. Smaller, homogeneous states like the UAE and Singapore have structural advantages in implementing uniform digital policies.
Contexto
In contrast, many countries in Africa, Central Asia, and Latin America report single-digit rates. The North-South divide is stark: the Global North reached 27.5% adoption, compared to 15.4% in the Global South. This gap mirrors existing digital inequalities and risks widening further as AI becomes central to productivity and job markets.
Key Data Points from the Report
| Country / Region | AI Adoption Rate (Q1 2026) | Notes |
|—————–|—————————-|——-|
| UAE | 70% | Quadruple global average growth |
| Singapore | 63% | Strong digital infrastructure |
| United States | 31% | Low despite being home to major AI companies |
| China | Not directly measured | Underestimated due to reliance on domestic AI tools |
| Global South | 15.4% | vs. 27.5% in the Global North |
Methodological Caveats
The report’s reliance on Microsoft telemetry means it over-represents the Microsoft ecosystem. While statistical adjustments are applied, the report cannot fully capture adoption in regions where non-Microsoft tools dominate. It also does not distinguish between casual and professional use — someone using Copilot once a month is counted the same as a daily power user. For a more complete picture, readers should consult additional sources such as the Stanford AI Index Report or country-specific surveys.
Why This Matters for AI Developers and Businesses
For developers and product managers, the report serves as a reality check: adoption is not uniform, and market strategies must account for wide variations in tool usage. A tool that sees high engagement in Europe may barely register in parts of Latin America or Africa. The data also suggests that enterprise and consumer AI adoption is still heavily mediated by Microsoft’s ecosystem, which may skew perceptions of market share. Open-source alternatives and non-Microsoft platforms may be more relevant in certain regions than the report captures.
What Remains Unclear
The report does not provide granular data on usage intensity, job roles, or industry sectors. It also does not explain why adoption rates vary so widely within similar income brackets — for example, Spain (44%) versus Italy (not in top 10). The undercount of China is a major gap, given the rapid growth of domestic models like DeepSeek and Kimi K3. Future reports from other sources will be needed to triangulate the true global picture.
Source: Xataka, “La ‘revolución’ de la IA va por barrios: el mapa que muestra quién manda y quién se ha quedado fuera” (https://www.xataka.com/servicios/revolucion-ia-va-barrios-mapa-que-muestra-quien-manda-quien-se-ha-quedado-fuera). Based on the Microsoft AI Diffusion Report Q1 2026, visualized by Visual Capitalist.
Datos clave
| Punto | Detalle |
|---|---|
| Fuente | Xataka IA |
| Fecha | 2026-07-26T08:00:27+00:00 |
| Tema | La "revolución" de la IA va por barrios: el mapa que muestra quién manda y quién se ha quedado fuera |
Source
Xataka IA Publicacion original: 2026-07-26T08:00:27+00:00
Related articles

OCU Finds Spanish Homeowner Communities Overpaying Up to €1,500 on Electricity and €3,515 on Gas—Can AI Tools Optimize Shared Energy Bills?
A new OCU analysis of Spanish homeowner community bills reveals widespread overpayment due to non-competitive tariffs and excess contracted power. Could AI-driven…
Read article
Mayotte fiber dispute does not meet ReviewArticle’s AI news brief
Le Monde reports that France’s competition authority has ordered Orange to suspend part of its fiber-optic rollout in Mayotte. The dispute is…
Read article
DiffEEG Model Uses Diffusion Pre-Training to Improve Seizure Detection from Minimal Labeled Data
Researchers have introduced DiffEEG, a 9.6-million-parameter foundation model that combines denoising diffusion pre-training with reinforcement learning fine-tuning to detect seizure events from…
Read article
The Technology Trap: Why AI Cannot Escape the Unchanging Fundamentals of War
A new Foreign Affairs essay by former Pentagon official Mara Karlin warns that over-reliance on AI and advanced tech in military planning…
Read articleWiki relacionada

AI Model API Pricing and Context Window Comparison: Current Rates and Limits
Compare the latest API pricing, context windows, and capabilities of leading AI model providers including OpenAI, Anthropic, Google, and Mistral. Practical guidance…
Read article
AI Agent Evaluation Frameworks: How to Benchmark Agentic Systems
A practical guide to evaluating AI agents — from task completion metrics to safety, cost, and robustness. Covers major frameworks, primary sources,…
Read article
LLM Benchmarks Decoded: What MMLU, HumanEval, and GSM8K Actually Measure for Developers
A developer-focused breakdown of the most-cited LLM benchmarks — MMLU, HumanEval, GSM8K, MATH, Chatbot Arena — including what they test, their hidden…
Read article
What Is RAG? A Practical Guide to Retrieval-Augmented Generation in 2025
Retrieval-Augmented Generation (RAG) grounds LLM outputs in external data, reducing hallucinations and enabling enterprise use cases. This guide covers how RAG works,…
Read article